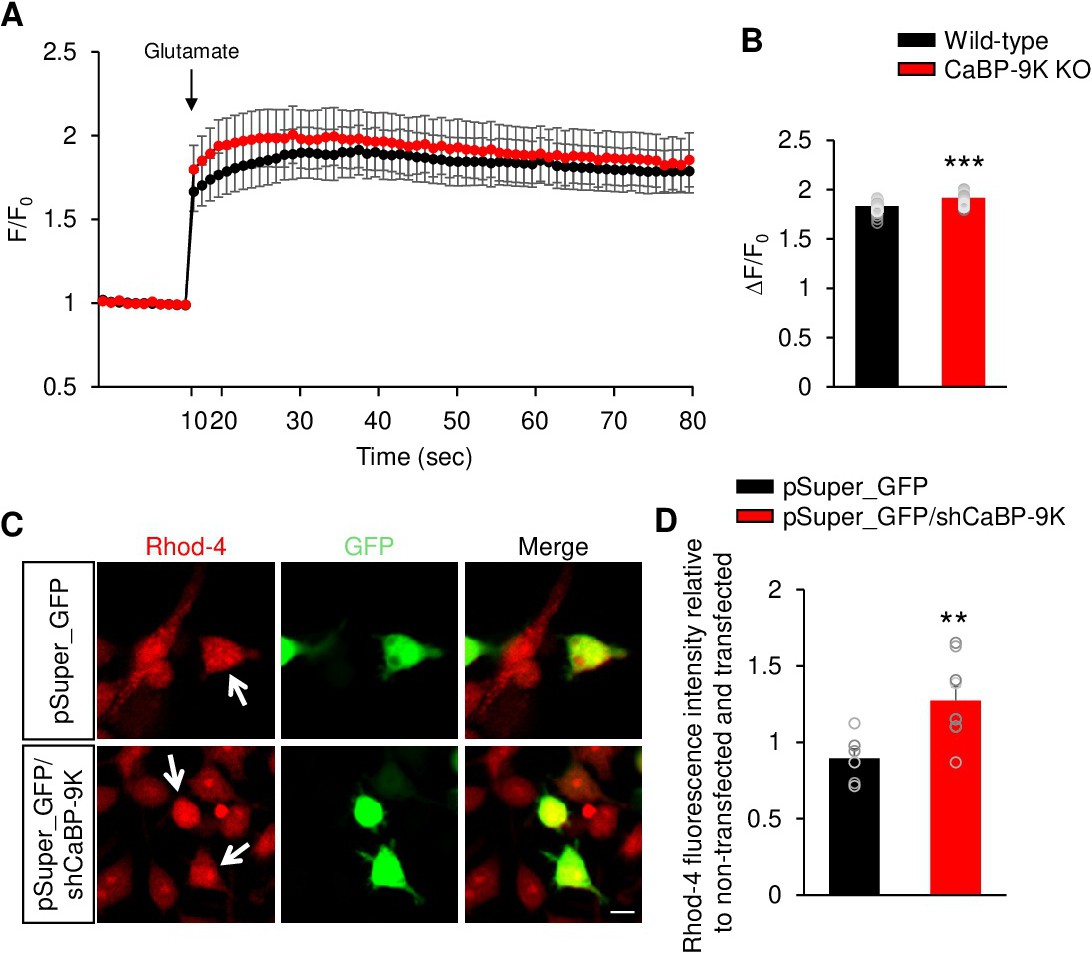
Fig. 4. CaBP-9k knockout leads to abnormal calcium response and calcium levels. (A) Primary neuronal cells loaded with the calcium indicator Rhod-4 were monitored by a fluorometric imaging plate reader calcium assay. CaBP-9k KO neuronal cells were treated after 7 days in vitro with 50 µM glutamate (arrow). Traces represent mean values with the SEMs. (B) Histogram showing the distribution of the maximum observed amplitude compared with the baseline of each analysed cell. n = 4 experiments for each condition. (C) Intracellular calcium concentration in Neuro2a cells is measured by Rhod-4 loading. (D) Quantification of C. n = 3 cell culture replicates. Data shown are the means ± SEMs and were analysed by two-tailed unpaired Student's t-tests.